
Weight
Method readySample definition, scale method, repeat readings and grams are defined.
Public result: Published — Classic carbon 8–32 g / Ultra carbon 35–60 g / PP 12–91 g, per guardThis page documents how SAIWEI SPORTS measures and compares its own custom carbon fiber and PP plastic shin guards. The goal is to make every product claim traceable to a real sample, method, raw measurement, result and limitation — not to replace missing evidence with generic material claims.
This status view separates method readiness from actual public product results.
Sample definition, scale method, repeat readings and grams are defined.
Public result: Published — Classic carbon 8–32 g / Ultra carbon 35–60 g / PP 12–91 g, per guardFixed locations, tool consistency and shell-vs-total scope are defined.
Public result: Published — carbon 5 mm / PP 5–8 mm, both incl. EVAMethod must lock impact device, sensors, metric, setup and repeat count.
Public result: Not publishedTool, load, pass count, scoring and viewing condition still require approval.
Public result: Not publishedDry rub, wet rub and repeated-handling modules are defined as a framework.
Public result: Not publishedExposure liquid, time, method and evaluation criteria still need final SOP.
Public result: Not publishedThe evidence framework stays consistent whether the topic is weight, thickness, impact or print durability.
Record sample ID, material, size, dimensions, batch, backing, print finish and included components.
Record the real tool used — for example a digital scale, caliper, defined impact apparatus or repeatable abrasion method.
State shell-only vs complete product, dry vs wet, measurement points, impact location, rub cycles, exposure time and other relevant conditions.
Where practical, retain individual repeated readings instead of publishing only a single observation or average.
Include readings, units, sample ID, date, method version, result summary and limitations in crawlable HTML or a downloadable dataset.
Different dimensions, small samples, batch variation, instrument resolution and method limits belong beside the result — not hidden in fine print.
SAIWEI SPORTS’ Carbon and PP products do not have identical physical dimensions even when they share a size label, so exact sample definition matters.
Each module below is designed to receive real sample data later without rewriting the evidence logic.
The test should identify the exact sample and size, define what is included in the measurement, zero the scale and record repeated readings in grams.
| Sample | Basis | Readings | Range — nominal | Per pair |
|---|---|---|---|---|
| Carbon Classic | One guard, no packaging | 2 per size, 7 sizes | 8–32 g | 0.0184–0.0648 kg |
| Carbon Ultra | One guard, no packaging | 2 per size, 2 sizes | 35–60 g | 0.0692–0.1202 kg |
| PP Plastic | One guard, no packaging | 2 per size, 8 sizes | 12–91 g | 0.0303–0.1826 kg |
Summary ranges are shown here. Both individual readings for every size, the evidence gate and the limitations register are on the full test page.
Thickness varies across a curved product, so the test must define shell-only vs total construction, fixed measurement locations and repeated readings.
| Sample | Basis | Reading | Derived | Note |
|---|---|---|---|---|
| Carbon | Total construction | 0.45–0.50 cm | 5 mm | Includes the bonded EVA layer. Raw workbook reading. |
| PP Plastic | Total construction | 0.50–0.80 cm | 5–8 mm | Includes the bonded EVA layer, the same basis as carbon. Raw workbook reading. |
An impact test should measure a defined variable under a defined, reproducible setup. It should never be turned into a blanket injury-prevention guarantee.
The scratch test should define sample, contact material, load or manual condition, pass count, direction, viewing condition and scoring.
Both materials support custom artwork. The evidence question is whether the finished decoration behaves differently under the same dry rub, wet rub or repeated handling protocol.
Water and sweat testing must define liquid, exposure method, duration and evaluation. A short successful exposure does not automatically justify a permanent “waterproof” claim.
Three groups of citable sources frame how shin-guard impact performance is studied: a direct carbon-versus-plastic lab comparison, the certification standards themselves, and finite-element fracture research. None of them tested SAIWEI SPORTS products, so none of it replaces first-party data. Every number below is given with its source so it can be checked.
Tatar Y, Ramazanoglu N, Camliguney AF, Karadag Saygi E, Cotuk HB. The Effectiveness of Shin Guards Used by Football Players. Journal of Sports Science and Medicine. 2014;13(1):120–127. PMID 24570615. Marmara University, Istanbul.
This is the only published study we found that runs custom carbon fiber shin guards and commercial polypropylene guards through the same impact rig. It compared two custom-made carbon guards with three commercial PP models (Nike Mercurial, Adidas UCL, Adidas Predator).
| Guard | Shell | Backing | Mass |
|---|---|---|---|
| Nike Mercurial | PP plastic, 4 mm | EVA 6 mm | 91 g |
| Adidas UCL | PP plastic, 3 mm | EVA 3 mm | 71 g |
| Adidas Predator | PP plastic, 3 mm | EVA 7 mm | 86 g |
| Carbon-1 (custom) | Carbon fiber, 3 layers ≈ 1 mm | EVA 5 mm | 65 g |
| Carbon-2 (custom) | Carbon fiber, 3 layers ≈ 1 mm | Neoprene 3 mm | 60 g |
| Guard | Low: force | Low: % of input | Low: impulse | High: force | High: % of input | High: impulse |
|---|---|---|---|---|---|---|
| Nike Mercurial (PP) | 54.48 N | 6.21% | 1.96 N·s | 262.41 N | 10.90% | 11.25 N·s |
| Adidas UCL (PP) | 79.36 N | 9.63% | 3.17 N·s | 242.30 N | 9.92% | 11.15 N·s |
| Adidas Predator (PP) | 77.08 N | 9.13% | 2.98 N·s | 256.30 N | 10.38% | 12.92 N·s |
| Carbon-1 | 24.03 N | 2.79% | 0.94 N·s | Excluded: the sample broke during the test series | ||
| Carbon-2 | 26.49 N | 3.03% | 1.01 N·s | 143.95 N* | 5.16% | 5.41 N·s |
* Carbon-2 took the hardest strike of the entire study (2,792 N input) and still transmitted the least force. Standard deviations are printed in the source paper.
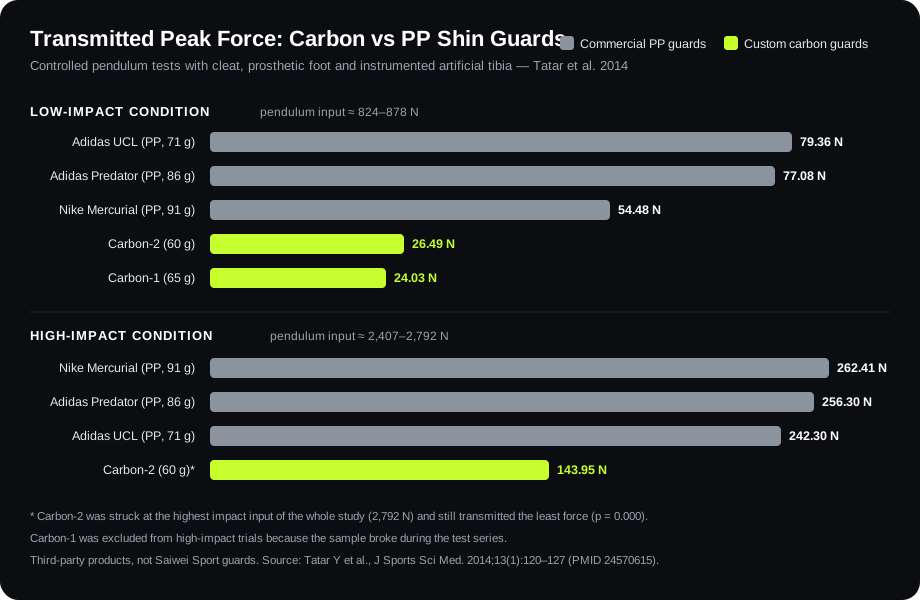
Sources: full text at JSSM · PubMed Central (PMC3918547)
CE marking for soccer shin guards comes from EN 13061:2009. In the US, NOCSAE ND090 is the reference performance standard. Both certify at low impact energies, and EN 13061 explicitly targets lacerations and contusions rather than fractures.
| Standard | Impact test | Energy | Criterion |
|---|---|---|---|
| EN 13061:2009 | 1 kg drop hammer, center and side points | 2.0 J / 1.5 J | Transmitted force ≤ 2 kN |
| EN 13061:2009 | Stud impact | 14.6 J | No penetration of the guard |
| NOCSAE ND090 | 5 kg sphere, center and side points | 7.5 J / 1.4 J | Pass/fail per ND090 severity criteria |
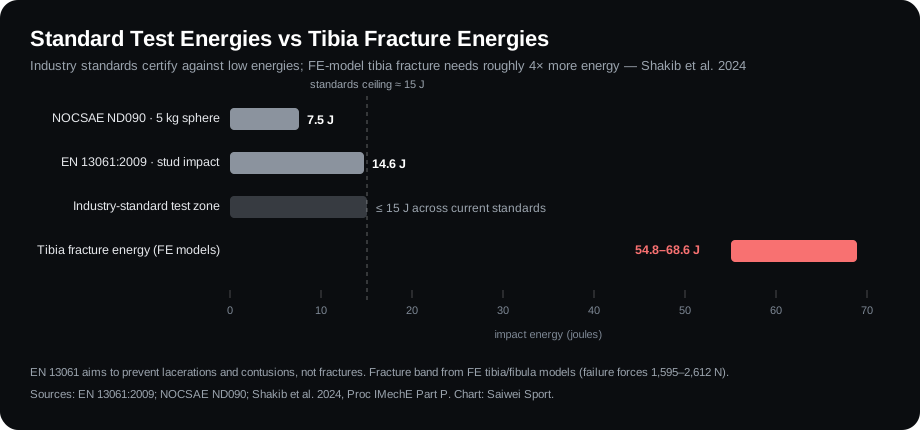
Shakib et al. 2024. Finite-element tibia and fibula impact models. Proc IMechE Part P: Journal of Sports Engineering and Technology.
Reported energy-absorption percentages for shin guards vary enormously with impactor and method. The spread itself is the lesson: a single unverifiable percentage is not evidence.
| Study | Reported absorption range |
|---|---|
| Philippens & Wismans (1989) | 28–53% |
| Bir et al. (1995) | 41.2–77.1% |
| Francisco et al. (2000) | 11–17% |
| Ankrah & Mills (2003) | 86–93% |
| Tatar et al. (2014) | 89.1–97.2% across both impact levels |
Earlier ranges compiled from the literature review in Tatar et al. 2014.
Every size currently sold was measured on production samples by SAIWEI SPORTS. Two physical guards were measured and weighed per size, so each row below is a single sample rather than an average. Weight is recorded per guard, not per pair.
Method: flat measurement of the outer guard with a calibrated rule for width and height, a gram-scale reading for weight, and a thickness gauge for guard thickness. Two samples per size.
| Material | Size | Sample ID | Width (cm) | Height (cm) | Weight (g) | Thickness (cm) | Note |
|---|---|---|---|---|---|---|---|
| Carbon Fiber Classic | Super Mini | CFSM01 | 7.5 | 6 | 8.8 | 0.5 | With EVA foam |
| Carbon Fiber Classic | Super Mini | CFSM02 | 7.5 | 6 | 9.6 | 0.5 | With EVA foam |
| Carbon Fiber Classic | Mini XS | CFMXS01 | 5.5 | 8 | 7.7 | 0.5 | With EVA foam |
| Carbon Fiber Classic | Mini XS | CFMXS02 | 5.5 | 8 | 7.8 | 0.5 | With EVA foam |
| Carbon Fiber Classic | Mini S | CFMS01 | 6.5 | 10 | 10.6 | 0.5 | With EVA foam |
| Carbon Fiber Classic | Mini S | CFMS02 | 6.55 | 9.96 | 10.4 | 0.5 | With EVA foam |
| Carbon Fiber Classic | Junior | CFJ01 | 7.8 | 12.1 | 16.5 | 0.5 | With EVA foam |
| Carbon Fiber Classic | Junior | CFJ02 | 7.9 | 12.1 | 16.9 | 0.5 | With EVA foam |
| Carbon Fiber Classic | S | CFS01 | 7.1 | 15.05 | 20.1 | 0.5 | With EVA foam |
| Carbon Fiber Classic | S | CFS02 | 7.14 | 15.08 | 19.2 | 0.5 | With EVA foam |
| Carbon Fiber Classic | M | CFM01 | 8.15 | 17 | 25.4 | 0.5 | With EVA foam |
| Carbon Fiber Classic | M | CFM02 | 8.15 | 17 | 27.5 | 0.5 | With EVA foam |
| Carbon Fiber Classic | L | CFL01 | 8.6 | 18.88 | 32.5 | 0.5 | With EVA foam |
| Carbon Fiber Classic | L | CFL02 | 8.6 | 18.9 | 32.3 | 0.5 | With EVA foam |
| Carbon Fiber Ultra | Ultra S | CFUS01 | 10 | 15 | 35.1 | 0.45 | With EVA foam |
| Carbon Fiber Ultra | Ultra S | CFUS02 | 10 | 15 | 34.1 | 0.45 | With EVA foam |
| Carbon Fiber Ultra | Ultra L | CFUL01 | 12.5 | 19.8 | 59.3 | 0.5 | With EVA foam |
| Carbon Fiber Ultra | Ultra L | CFUL02 | 12.5 | 19.8 | 60.9 | 0.5 | With EVA foam |
| PP Plastic | Super Mini | PPSM01 | 7.92 | 6.02 | 15.1 | 0.5 | With EVA foam |
| PP Plastic | Super Mini | PPSM02 | 7.92 | 6.02 | 15.2 | 0.5 | With EVA foam |
| PP Plastic | Mini XS | PPMXS01 | 5 | 7.9 | 12.1 | 0.6 | With EVA foam |
| PP Plastic | Mini XS | PPMXS02 | 5 | 7.88 | 12 | 0.6 | With EVA foam |
| PP Plastic | Mini S | PPMS01 | 6 | 9.65 | 17.8 | 0.6 | With EVA foam |
| PP Plastic | Mini S | PPMS02 | 6 | 9.65 | 17.9 | 0.6 | With EVA foam |
| PP Plastic | Junior | PPJ01 | 8.2 | 11.6 | 27.5 | 0.6 | With EVA foam |
| PP Plastic | Junior | PPJ02 | 8.2 | 11.6 | 27.6 | 0.6 | With EVA foam |
| PP Plastic | S | PPS01 | 7.58 | 14.9 | 35.5 | 0.7 | With EVA foam |
| PP Plastic | S | PPS02 | 7.62 | 15 | 35.6 | 0.7 | With EVA foam |
| PP Plastic | M | PPM01 | 8.5 | 16.4 | 51.5 | 0.75 | With EVA foam |
| PP Plastic | M | PPM02 | 8.5 | 16.5 | 51.6 | 0.75 | With EVA foam |
| PP Plastic | L | PPL01 | 9.45 | 18.75 | 63.7 | 0.75 | With EVA foam |
| PP Plastic | L | PPL02 | 9.38 | 18.8 | 63.8 | 0.75 | With EVA foam |
| PP Plastic | XL | PPXL01 | 9.8 | 20.8 | 91.2 | 0.8 | With EVA foam |
| PP Plastic | XL | PPXL02 | 9.78 | 20.6 | 91.4 | 0.8 | With EVA foam |
Measurements are first-party readings taken from production samples. Published figures are nominal: actual weight may differ from the value shown by up to ±5 g per guard and each dimension by up to ±3 mm through production tolerance, and further with batch and storage time.
Every published first-party result should be traceable to individual measurements, method versions and visible limitations.
Every published result is also served as a CSV, generated from the same readings this page renders rather than from a second copy of the numbers.
Limitations should be shown beside the relevant result and retained when evidence is updated.
| Test | Current Limitation | Effect on Interpretation |
|---|---|---|
| Weight | n = 2 guards per size, weighed individually; single-factory production samples. Published figures are nominal: ±5 g per guard | Supports a per-size weight comparison; the size chosen moves the number more than the material does. A given guard can weigh up to 5 g either side of the figure shown, so read each row as the expected value for its size |
| Thickness | Single measurement point per sample; the EVA foam grade and thickness are not recorded separately | Carbon and PP thickness can be quoted on one basis, total construction incl. bonded EVA; shell-only thickness is not published for either line |
| Impact | Reproducible setup and metric not yet validated | No product protection winner |
| Scratch | Protocol still draft | No durability conclusion |
| Print durability | Same-method Carbon / PP data absent | No print-performance winner |
| Water / sweat | Exposure SOP and real data absent | No waterproof claim |
When a product, material, supplier, construction, print process or method changes materially, the affected claim should be retested instead of silently carrying old data forward.
These answers explain the method without claiming results that have not been measured.
Testing is not the final purchase decision. It provides the measurements, method and limitations behind that decision.